
Telemetry, in simple terms, is like having a conversation with machines or systems located far away. It's about collecting data from these distant sources to better understand how they're performing. Think of it as a health check-up, but for machines or systems instead of people.
This technology plays a crucial role in a variety of fields. In agriculture, it helps monitor crop conditions; in healthcare, it keeps tabs on patient metrics like blood pressure and blood sugar levels; and in weather forecasting, it's indispensable for predicting mother nature's next move.
So, it's a bit like having a network of digital spies scattered in different areas, each sending back valuable information that lets us peek into the functioning of systems we can't be physically present at.
Telemetry in IT
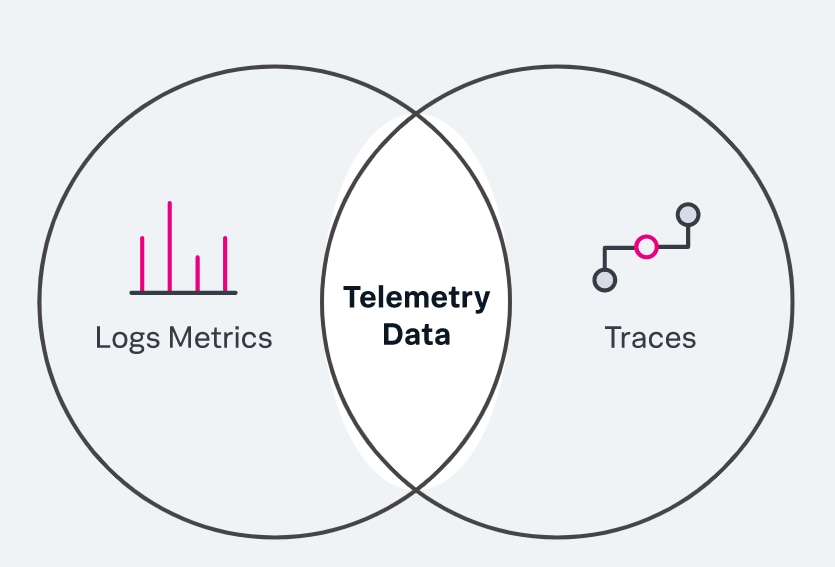
In the world of technology and complex software, telemetry is crucial for software optimization. It involves collecting data from various software deployments to understand performance in different environments. This helps in quickly identifying and fixing issues, leading to better, more adaptable software. For example, analyzing logs from different deployments can reveal specific areas for improvement or just tracing data for user engagement.
But monitoring does the same thing, right?
Although they are terms that are used interchangeably, there are slight hierarchial differences between them.
- Monitoring, in general, is used to detect potential issues in the system using things like application metrics and network usage
- Telemetry does a lot of things, from troubleshooting issues to understanding user behavior and system performance. It also uses wider parameters for its activities.
So, we can say that monitoring is a subset of telemetry. It provides deeper monitoring capabilities and system metrics.
Network Telemetry
Imagine having a enterprise level network. It becomes crucial for the admin to constantly monitor the data flow and network traffic that is going through the endpoints. This is where network telemetry comes in.
Network Telemetry is a subset of telemetry. It involves gathering of data from sources like routers, switches, servers and applications and how data moves through them.
One method to achieve this is through capture network traffic and analyse them. These tools provide information about network bandwidth, latency, packet loss, and other performance metrics.
Capturing Network Traffic
Capturing network traffic is a fundamental aspect of network telemetry. It involves monitoring and recording the data packets that travel across a network. This data can include packet headers, payload, source and destination IP addresses, port numbers, protocol types, and more. Analyzing this captured data helps in identifying traffic patterns, detecting anomalies, diagnosing network issues, and ensuring network security.
Role of eBPF in Network Telemetry
Before eBPF, we had tcpdump, which tracked and recorded HTTP packets. The problem was that it did it in multiple sessions which we had to arrange, creating a tedious task. This is where precisely eBPF came in. Released in 2014, eBPF was a paradigm shift in network telemetry. It allowed executing code directly into the Linux Kernel without actually altering the code in it. More specifically, it allowed packet filtering and capturing traffic, through which automatically removed the irrelevant data,enabling you to process and filter your application traffic with only a limited effect on performance, even when throughput is high.
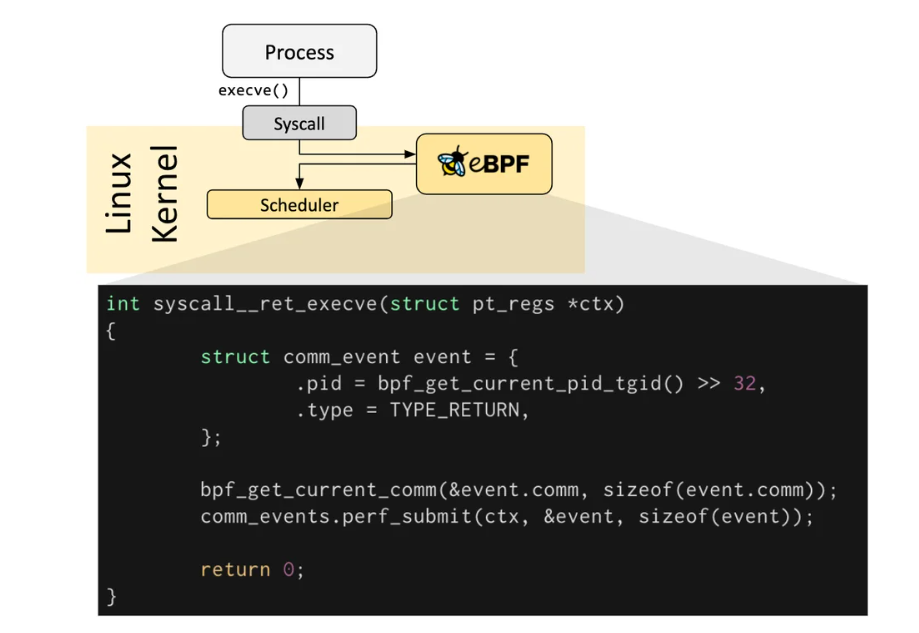
eBPF lets you add a hook to kernel system calls(syscalls) and helper functions, allowing you to provide visibility into traffic payloads and function results (success/failure).
As a result, with eBPF, you can enable complex functionality and processing of network traffic, including layer-7 filtering, independently of the application sending data to the kernel.
Tools for using eBPF
Numerous tools exist that facilitate the interaction with and creation of interfaces for developers to utilize eBPF code. Additionally, various programming languages can be employed to write or interface with eBPF code. Let's look at some tools like that:
- BCC: BCC(BPF Compiler Collection) is a toolkit used for efficient kernel tracing and manipulation programs. It makes eBPF programs easier to write as well as creating front-ends with Python, Lua etc. It makes performance analysis and network traffic control.
- libbpf: libbpf is a C based library that has a BPF loader. It takes the object compiler BPF object file and loads it into the Linux Kernel. It does the job of loading, verifying and attaching BPF programs to kernel hooks so that the developer should only focus on BPF program correctness and efficiency.
- bpftrace: A high-level tracing language for Linux eBPF. It's great for ad-hoc kernel and user space tracing. With bpftrace, you can write and execute scripts to analyze performance issues, track down problems, or understand software behavior.
Enough talk! Let's code to make sense of everything above!
Sample Code
For this demonstration, we will utilize an example sourced from the official BCC GitHub repository.
This script is a Python program using BCC (BPF Compiler Collection) for tracing TCP IPv4 connection attempts in Linux using eBPF (Extended Berkeley Packet Filter) with embedded C code. It's designed to capture all IPv4 connection attempts, successful or not.
Prerequisites
- Operating System: A Linux distribution, as BCC is Linux-specific.
- Python: Make sure Python 3.10+ is installed on your machine
BCC Installation:
Install Build dependencies:
-
For Bionic(18.04 LTS):
sudo apt-get -y install zip bison build-essential cmake flex git libedit-dev \ libllvm6.0 llvm-6.0-dev libclang-6.0-dev python zlib1g-dev libelf-dev libfl-dev python3-setuptools \ liblzma-dev arping netperf iperf -
For Focal(20.04.1 LTS):
sudo apt install -y zip bison build-essential cmake flex git libedit-dev \ libllvm12 llvm-12-dev libclang-12-dev python zlib1g-dev libelf-dev libfl-dev python3-setuptools \ liblzma-dev arping netperf iperf -
For Hirsute(21.04) or Impish (21.10):
sudo apt install -y zip bison build-essential cmake flex git libedit-dev \ libllvm11 llvm-11-dev libclang-11-dev python3 zlib1g-dev libelf-dev libfl-dev python3-setuptools \ liblzma-dev arping netperf iperf -
For Jammy(22.04):
sudo apt install -y zip bison build-essential cmake flex git libedit-dev \ libllvm14 llvm-14-dev libclang-14-dev python3 zlib1g-dev libelf-dev libfl-dev python3-setuptools \ liblzma-dev libdebuginfod-dev arping netperf iperf -
For Lunar Lobster(23.04):
sudo apt install -y zip bison build-essential cmake flex git libedit-dev \ libllvm15 llvm-15-dev libclang-15-dev python3 zlib1g-dev libelf-dev libfl-dev python3-setuptools \ liblzma-dev libdebuginfod-dev arping netperf iperf libpolly-15-dev -
For other versions:
sudo apt-get -y install zip bison build-essential cmake flex git libedit-dev \ libllvm3.7 llvm-3.7-dev libclang-3.7-dev python zlib1g-dev libelf-dev python3-setuptools \ liblzma-dev arping netperf iperf -
For Lua support:
sudo apt-get -y install luajit luajit-5.1-dev
Install and compile BCC:
git clone https://github.com/iovisor/bcc.git
mkdir bcc/build; cd bcc/build
cmake ..
make
sudo make install
cmake -DPYTHON_CMD=python3 .. # build python3 binding
pushd src/python/
make
sudo make install
popd
Code:
#!/usr/bin/python

from __future__ import print_function
from bcc import BPF
from bcc.utils import printb

# define BPF program
bpf_text = """
#include <uapi/linux/ptrace.h>
#include <net/sock.h>
#include <bcc/proto.h>

BPF_HASH(currsock, u32, struct sock *);

int kprobe__tcp_v4_connect(struct pt_regs *ctx, struct sock *sk)
{
	u32 pid = bpf_get_current_pid_tgid();

	// stash the sock ptr for lookup on return
	currsock.update(&pid, &sk);

	return 0;
};

int kretprobe__tcp_v4_connect(struct pt_regs *ctx)
{
	int ret = PT_REGS_RC(ctx);
	u32 pid = bpf_get_current_pid_tgid();

	struct sock **skpp;
	skpp = currsock.lookup(&pid);
	if (skpp == 0) {
		return 0;	// missed entry
	}

	if (ret != 0) {
		// failed to send SYNC packet, may not have populated
		// socket __sk_common.{skc_rcv_saddr, ...}
		currsock.delete(&pid);
		return 0;
	}

	// pull in details
	struct sock *skp = *skpp;
	u32 saddr = skp->__sk_common.skc_rcv_saddr;
	u32 daddr = skp->__sk_common.skc_daddr;
	u16 dport = skp->__sk_common.skc_dport;

	// output
	bpf_trace_printk("trace_tcp4connect %x %x %d\\n", saddr, daddr, ntohs(dport));

	currsock.delete(&pid);

	return 0;
}
"""

# initialize BPF
b = BPF(text=bpf_text)

# header
print("%-6s %-12s %-16s %-16s %-4s" % ("PID", "COMM", "SADDR", "DADDR",
    "DPORT"))

def inet_ntoa(addr):
	dq = b''
	for i in range(0, 4):
		dq = dq + str(addr & 0xff).encode()
		if (i != 3):
			dq = dq + b'.'
		addr = addr >> 8
	return dq

# filter and format output
while 1:
    # Read messages from kernel pipe
    try:
        (task, pid, cpu, flags, ts, msg) = b.trace_fields()
        (_tag, saddr_hs, daddr_hs, dport_s) = msg.split(b" ")
    except ValueError:
        # Ignore messages from other tracers
        continue
    except KeyboardInterrupt:
        exit()

    # Ignore messages from other tracers
    if _tag.decode() != "trace_tcp4connect":
        continue

    printb(b"%-6d %-12.12s %-16s %-16s %-4s" % (pid, task,
        inet_ntoa(int(saddr_hs, 16)),
        inet_ntoa(int(daddr_hs, 16)),
        dport_s))
Run the program:
sudo python tcpv4connect.py
Code Breakdown:
- BPF Program: The BPF program is written in C. It is embedded in a script in form of a multiline string.
- kprobe__tcp_v4_connect: A kprobe(kernel probe) is attached to 'tcp_v4_connect' whenever a TCP connection is established by a process, whether it is succeeding or not. This function records the socket information associated with a PID.
- kretprobe_tcp_v4_connect: A kretprobe(return probe) is attached to the same 'tcp_v4_connect' function and is triggered whenever it returns a response. It retrieves the socket info and extracts the connections details and prints it using 'bpf_trace_printk'.
In the rest of Python Script, The script enters an infinite loop where it reads output messages from the BPF program (via b.trace_fields()).
- It filters out messages from other BCC programs and ignores non-relevant data.
- For relevant messages (tagged with "trace_tcp4connect"), the script parses and displays the connection details in a human-readable format.
OUTPUT:
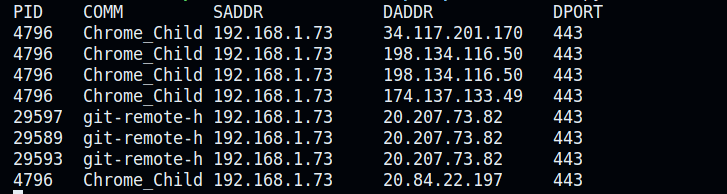
- PID: the identifier for the process that initiated the connection.
- COMM: the name of process or command.
- SADDR (Source Address): The local IP address of the machine where the connections are being initiated.
- DADDR: The remote IP address to which the connection is being made.
- The remote IP address to which the connection is being made. These are varied and could represent different web services or servers.
- DPORT: The port number at the destination address. In all these cases, the port is
443, which is commonly used for HTTPS traffic, indicating secure web connections.
SUMMARY
Network telemetry functions as a network sleuth, collecting information and insights regarding the network's operation and efficiency. This tool equips network managers with the necessary resources to ensure their network infrastructure remains strong and effective.
Thus, for both seasoned network experts and those new to networking, network telemetry is an essential tool for overseeing and enhancing your network.
FAQ's
What is telemetry, and why is it important in network monitoring?
Telemetry involves collecting data from remote sources to monitor network performance, aiding in proactive issue detection and optimization.
How does network telemetry differ from traditional monitoring approaches?
Network telemetry offers deeper insights than traditional monitoring by capturing detailed data on traffic patterns, latency, and packet loss in real-time.
What are the benefits of using eBPF for network telemetry?
eBPF enables efficient network telemetry by allowing code execution within the Linux Kernel, facilitating advanced packet filtering and traffic analysis.
What are some common challenges in implementing network telemetry, and how can they be addressed?
Challenges in network telemetry implementation include ensuring compatibility with diverse network environments and managing the overhead of data collection without impacting performance.